
The Story of Zillow
This is a summary of my last four posts concerning Zillow data and how it tells a describes the housing market.
Inspiration Behind the Project
Zillow is a website full of data waiting to be analyzed. When I began this project, I was in the midst of remodeling my first investment property. This inspired me to do a check on the current market and see what trends there were. Throughout the process I have been able to gather housing data from several cities in Utah and run the numbers to see price points, bed and bath counts, common square footage, and price per square foot. In addition to these common indicators, I was also able to create unique indicators like ‘best deal’ or bed/bath ratio. These allowed me to further analyze what value a home has.
Analyzing the Data
After gathering all the data, I took time to run visuals. What this essentially did was give me a better idea of where to direct my focus. As I progressed further into the project, I has initially started with just analyzing one city, but by the time I was finished I was analzying across several cities to see if there were significant differences. This was especially helpful in looking for future rental or investment properties.
Paint the Picture
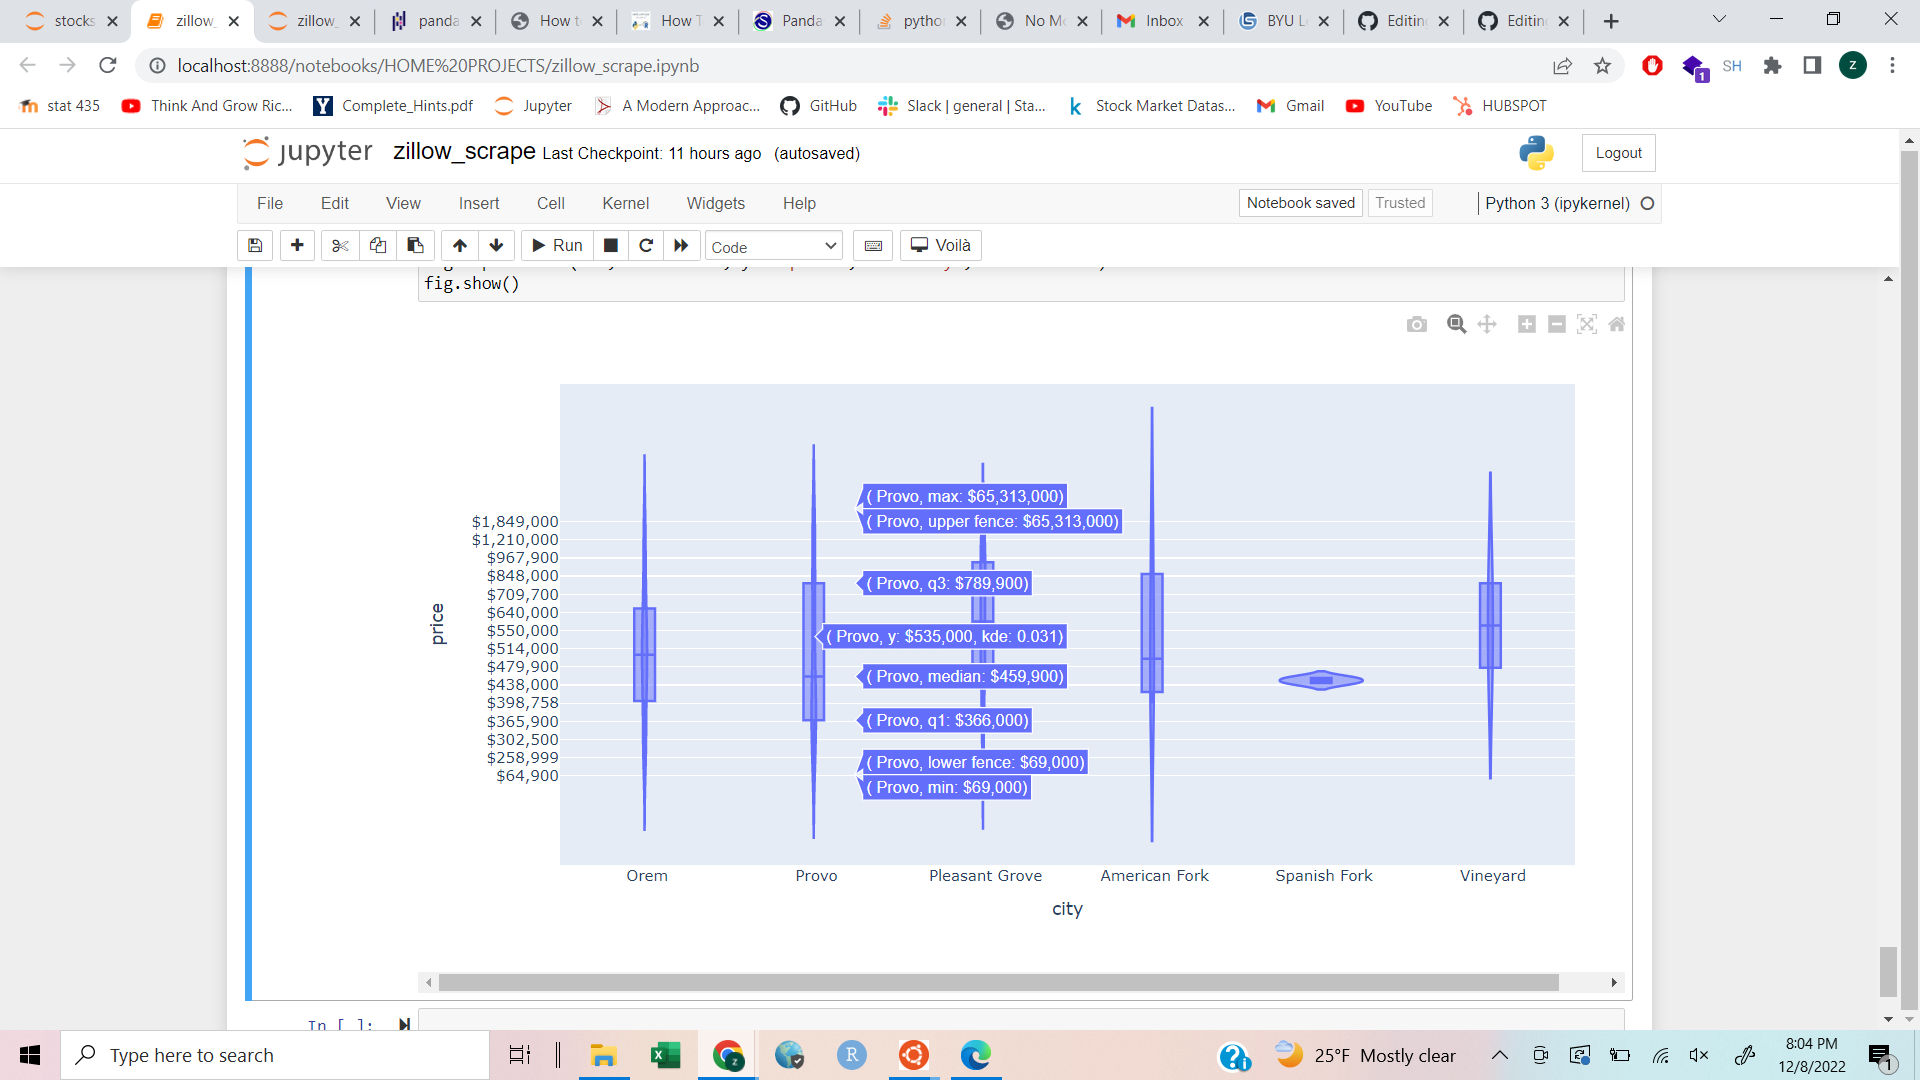
In this graphic, the story to tell is really comparing the housing market across cities. These violin charts show the distribution of homes with regard to price across several cities.
Something unique about these charts is that they are interactive and display a lot of information with just the hover of the mouse.
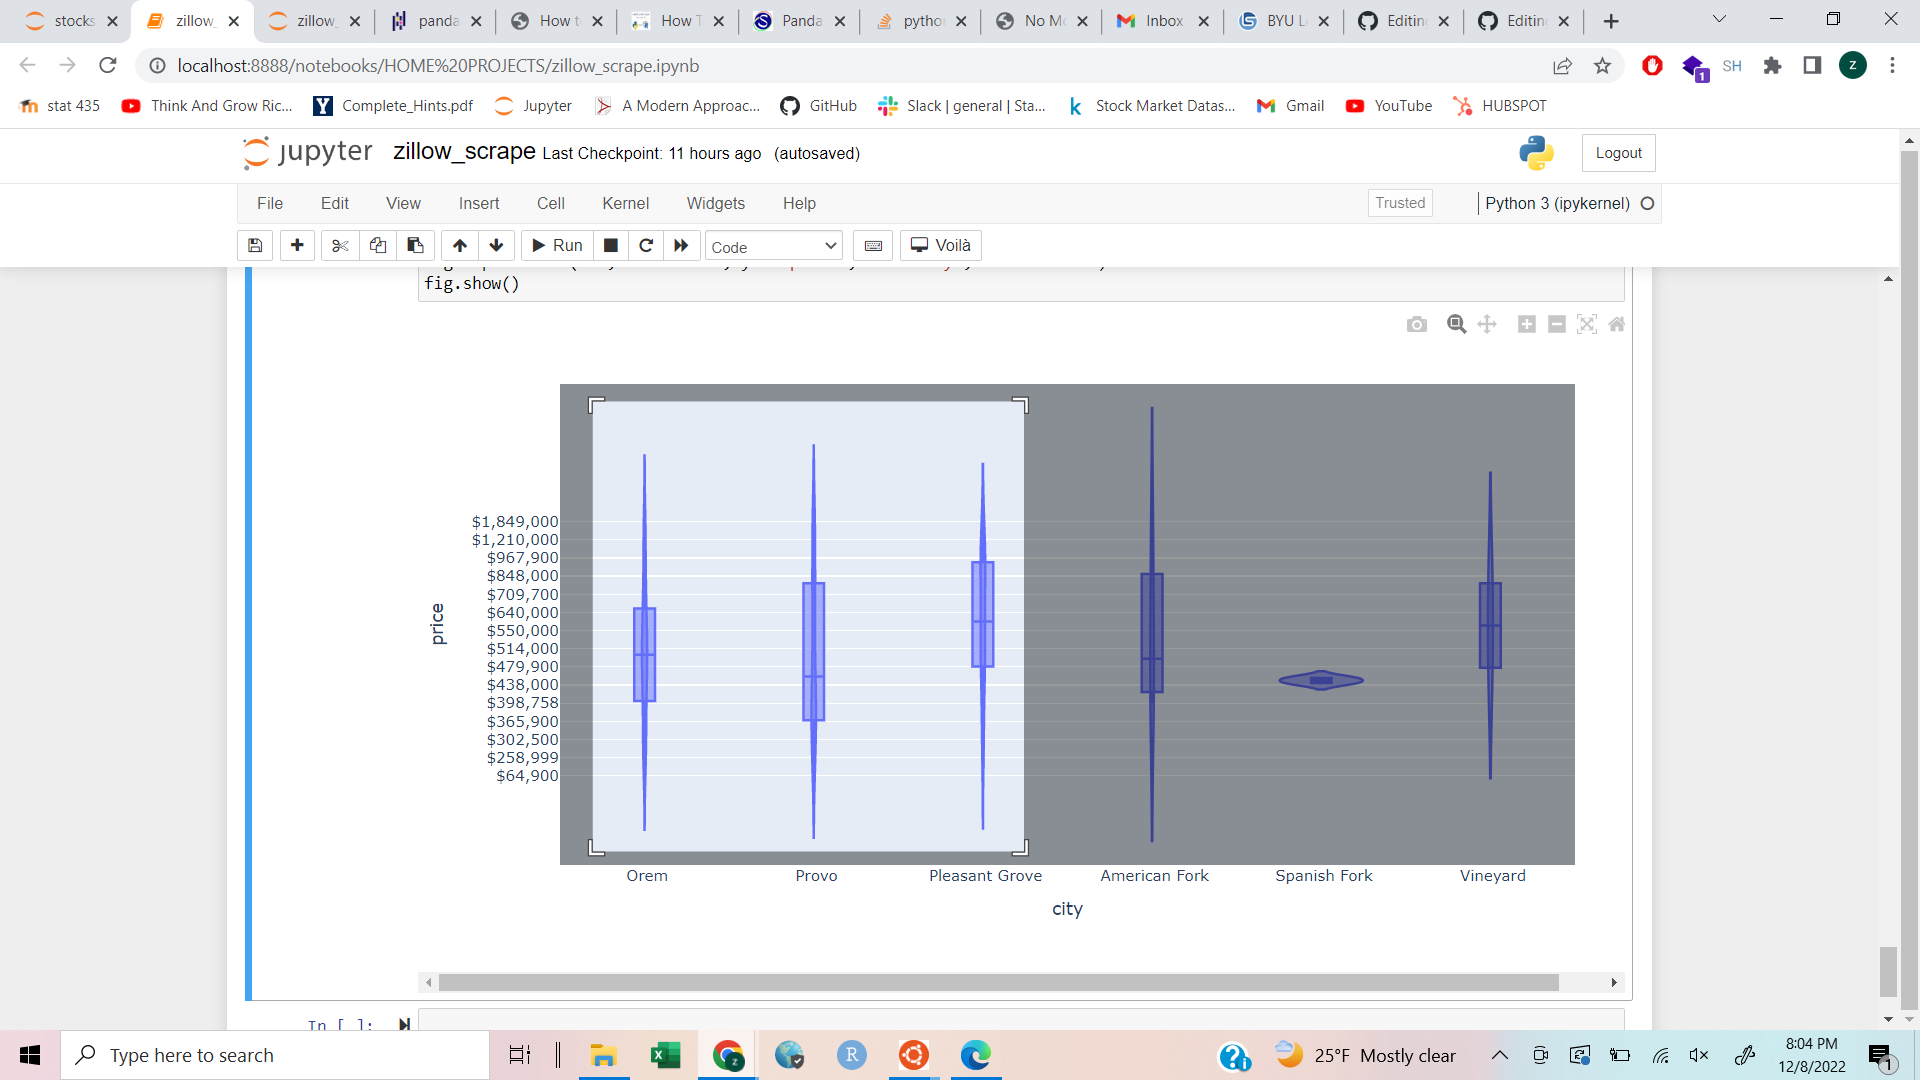
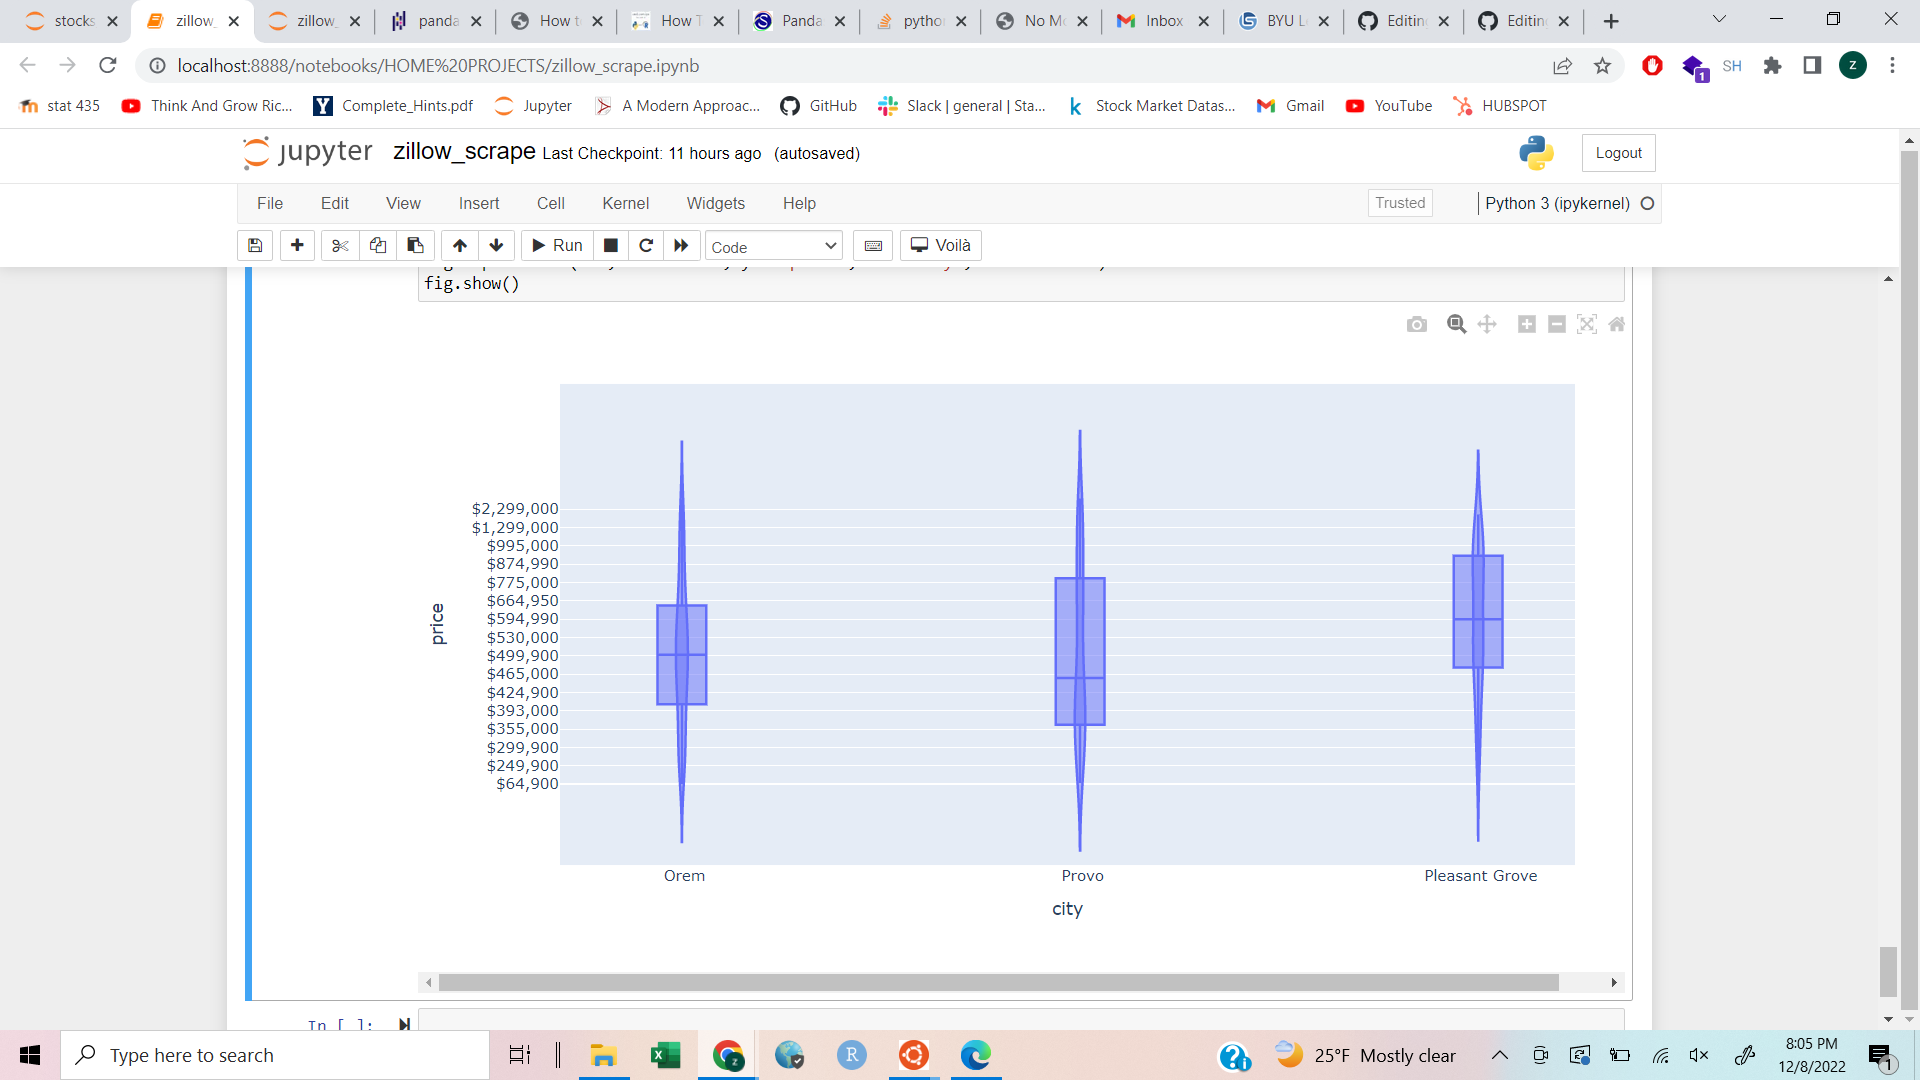
Another interesting piece to this is the ability to zoom and isolate and compare specific cities with just the drag of your mouse.
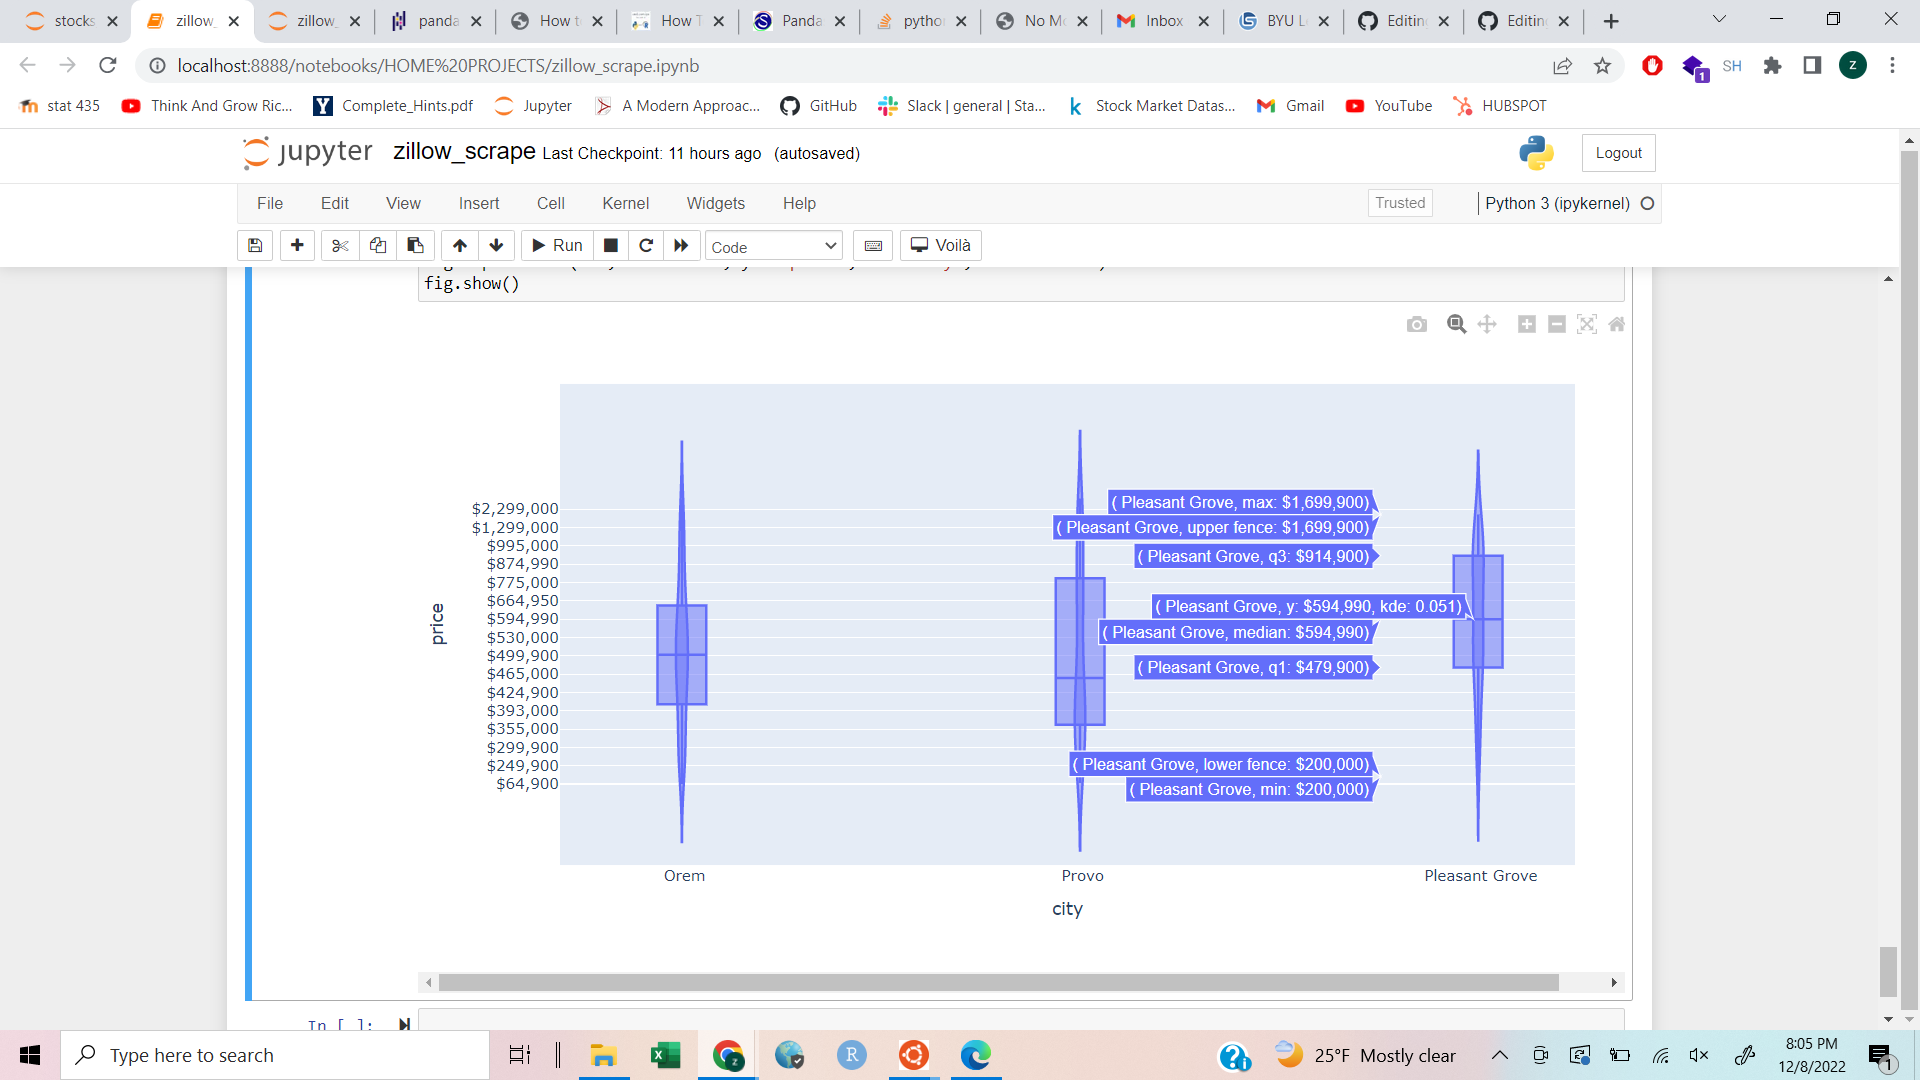
From our analysis, it can be concluded that the median house price is highest in Pleasant Grove compared to the other cities.Additionally, American Fork seems to have the largest spread of houses on the market, and Spanish Fork has the least spread.
Follow Along
Keep up to date, and run this code on your own device. Use this link to find the goodies. GitHub Repo